


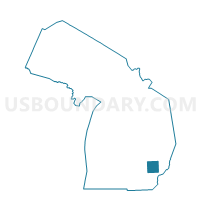
Hazel Park city, Oakland County, Michigan
About
Outline

Summary
| Unique Area Identifier | 135649 |
| Name | Hazel Park city |
| County | Oakland County |
| State | Michigan |
| Area (square miles) | 2.82 |
| Land Area (square miles) | 2.82 |
| Water Area (square miles) | 0.00 |
| % of Land Area | 100.00 |
| % of Water Area | 0.00 |
| Latitude of the Internal Point | 42.46192410 |
| Longtitude of the Internal Point | -83.09768910 |
| Total Population | 16,422 |
| Total Housing Units | 7,611 |
| Total Households | 6,641 |
| Median Age | 36.1 |
Maps

Graphs
Select a template below for downloading or customizing gragh for Hazel Park city, Oakland County, Michigan


Neighbors
Neighoring County Subdivision (by Name) Neighboring County Subdivision on the Map
- Detroit city, Wayne County, MI
- Ferndale city, Oakland County, MI
- Madison Heights city, Oakland County, MI
- Royal Oak city, Oakland County, MI
- Warren city, Macomb County, MI
Top 10 Neighboring Place (by Population) Neighboring Place on the Map
- Detroit city, MI (713,777)
- Warren city, MI (134,056)
- Royal Oak city, MI (57,236)
- Madison Heights city, MI (29,694)
- Ferndale city, MI (19,900)
- Hazel Park city, MI (16,422)
Top 10 Neighboring Unified School District (by Population) Neighboring Unified School District on the Map
- Detroit City School District, MI (713,865)
- Royal Oak City School District, MI (57,913)
- Hazel Park City School District, MI (20,911)
- Fitzgerald Public Schools, MI (17,207)
- Madison Public Schools, MI (11,927)
Top 10 Neighboring State Legislative District Lower Chamber (by Population) Neighboring State Legislative District Lower Chamber on the Map
- State House District 28, MI (89,381)
- State House District 26, MI (86,932)
- State House District 27, MI (83,872)
- State House District 7, MI (62,725)
Top 10 Neighboring State Legislative District Upper Chamber (by Population) Neighboring State Legislative District Upper Chamber on the Map
- State Senate District 13, MI (259,747)
- State Senate District 14, MI (257,297)
- State Senate District 9, MI (249,029)
- State Senate District 4, MI (188,440)
Top 10 Neighboring 111th Congressional District (by Population) Neighboring 111th Congressional District on the Map
- Congressional District 12, MI (636,601)
- Congressional District 14, MI (550,465)
- Congressional District 13, MI (519,570)
Top 10 Neighboring Census Tract (by Population) Neighboring Census Tract on the Map
- Census Tract 2636, Macomb County, MI (5,279)
- Census Tract 1751, Oakland County, MI (5,083)
- Census Tract 1816, Oakland County, MI (4,806)
- Census Tract 1730, Oakland County, MI (4,694)
- Census Tract 1753, Oakland County, MI (4,310)
- Census Tract 2635, Macomb County, MI (4,233)
- Census Tract 1752, Oakland County, MI (4,062)
- Census Tract 5068, Wayne County, MI (3,865)
- Census Tract 2624, Macomb County, MI (3,247)
- Census Tract 1750, Oakland County, MI (2,967)
Top 10 Neighboring 5-Digit ZIP Code Tabulation Area (by Population) Neighboring 5-Digit ZIP Code Tabulation Area on the Map
- 48234, MI (36,140)
- 48091, MI (31,106)
- 48071, MI (29,694)
- 48203, MI (28,409)
- 48067, MI (24,458)
- 48220, MI (22,319)
- 48030, MI (16,422)
Data
Demographic, Population, Households, and Housing Units
** Data sources from census 2010 **
Show Data on Map
Download Full List as CSV
Download Quick Sheet as CSV
| Subject | This Area | Oakland County | Michigan | National |
|---|---|---|---|---|
| POPULATION | ||||
| Total Population Map | 16,422 | 1,202,362 | 9,883,640 | 308,745,538 |
| POPULATION, HISPANIC OR LATINO ORIGIN | ||||
| Not Hispanic or Latino Map | 15,976 | 1,160,442 | 9,447,282 | 258,267,944 |
| Hispanic or Latino Map | 446 | 41,920 | 436,358 | 50,477,594 |
| POPULATION, RACE | ||||
| White alone Map | 13,599 | 928,912 | 7,803,120 | 223,553,265 |
| Black or African American alone Map | 1,608 | 164,078 | 1,400,362 | 38,929,319 |
| American Indian and Alaska Native alone Map | 140 | 3,376 | 62,007 | 2,932,248 |
| Asian alone Map | 243 | 67,828 | 238,199 | 14,674,252 |
| Native Hawaiian and Other Pacific Islander alone Map | 4 | 254 | 2,604 | 540,013 |
| Some Other Race alone Map | 71 | 11,584 | 147,029 | 19,107,368 |
| Two or More Races Map | 757 | 26,330 | 230,319 | 9,009,073 |
| POPULATION, SEX | ||||
| Male Map | 8,108 | 583,384 | 4,848,114 | 151,781,326 |
| Female Map | 8,314 | 618,978 | 5,035,526 | 156,964,212 |
| POPULATION, AGE (18 YEARS) | ||||
| 18 years and over Map | 12,455 | 920,257 | 7,539,572 | 234,564,071 |
| Under 18 years | 3,967 | 282,105 | 2,344,068 | 74,181,467 |
| POPULATION, AGE | ||||
| Under 5 years | 1,060 | 68,506 | 596,286 | 20,201,362 |
| 5 to 9 years | 1,022 | 77,140 | 637,784 | 20,348,657 |
| 10 to 14 years | 1,156 | 83,450 | 675,216 | 20,677,194 |
| 15 to 17 years | 729 | 53,009 | 434,782 | 12,954,254 |
| 18 and 19 years | 478 | 28,040 | 304,817 | 9,086,089 |
| 20 years | 207 | 12,413 | 149,350 | 4,519,129 |
| 21 years | 205 | 11,651 | 138,484 | 4,354,294 |
| 22 to 24 years | 663 | 39,280 | 381,238 | 12,712,576 |
| 25 to 29 years | 1,164 | 71,670 | 589,583 | 21,101,849 |
| 30 to 34 years | 1,270 | 71,717 | 574,566 | 19,962,099 |
| 35 to 39 years | 1,179 | 80,354 | 612,493 | 20,179,642 |
| 40 to 44 years | 1,225 | 89,478 | 665,481 | 20,890,964 |
| 45 to 49 years | 1,245 | 98,381 | 744,581 | 22,708,591 |
| 50 to 54 years | 1,284 | 99,877 | 765,452 | 22,298,125 |
| 55 to 59 years | 974 | 86,571 | 683,186 | 19,664,805 |
| 60 and 61 years | 300 | 30,307 | 243,067 | 7,113,727 |
| 62 to 64 years | 412 | 41,394 | 325,744 | 9,704,197 |
| 65 and 66 years | 209 | 21,692 | 177,313 | 5,319,902 |
| 67 to 69 years | 305 | 28,628 | 241,312 | 7,115,361 |
| 70 to 74 years | 391 | 33,783 | 306,084 | 9,278,166 |
| 75 to 79 years | 344 | 27,347 | 244,085 | 7,317,795 |
| 80 to 84 years | 308 | 23,917 | 200,855 | 5,743,327 |
| 85 years and over | 292 | 23,757 | 191,881 | 5,493,433 |
| MEDIAN AGE BY SEX | ||||
| Both sexes Map | 36.10 | 40.20 | 38.90 | 37.20 |
| Male Map | 35.30 | 39.00 | 37.60 | 35.80 |
| Female Map | 36.90 | 41.30 | 40.00 | 38.50 |
| HOUSEHOLDS | ||||
| Total Households Map | 6,641 | 483,698 | 3,872,508 | 116,716,292 |
| HOUSEHOLDS, HOUSEHOLD TYPE | ||||
| Family households: Map | 3,999 | 318,152 | 2,554,073 | 77,538,296 |
| Husband-wife family Map | 2,240 | 245,359 | 1,857,127 | 56,510,377 |
| Other family: Map | 1,759 | 72,793 | 696,946 | 21,027,919 |
| Male householder, no wife present Map | 507 | 18,879 | 185,363 | 5,777,570 |
| Female householder, no husband present Map | 1,252 | 53,914 | 511,583 | 15,250,349 |
| Nonfamily households: Map | 2,642 | 165,546 | 1,318,435 | 39,177,996 |
| Householder living alone Map | 2,136 | 138,388 | 1,079,678 | 31,204,909 |
| Householder not living alone Map | 506 | 27,158 | 238,757 | 7,973,087 |
| HOUSEHOLDS, HISPANIC OR LATINO ORIGIN OF HOUSEHOLDER | ||||
| Not Hispanic or Latino householder: Map | 6,519 | 471,963 | 3,757,825 | 103,254,926 |
| Hispanic or Latino householder: Map | 122 | 11,735 | 114,683 | 13,461,366 |
| HOUSEHOLDS, RACE OF HOUSEHOLDER | ||||
| Householder who is White alone | 5,745 | 383,646 | 3,158,462 | 89,754,352 |
| Householder who is Black or African American alone | 573 | 66,740 | 523,980 | 14,129,983 |
| Householder who is American Indian and Alaska Native alone | 51 | 1,268 | 22,676 | 939,707 |
| Householder who is Asian alone | 75 | 22,337 | 74,263 | 4,632,164 |
| Householder who is Native Hawaiian and Other Pacific Islander alone | 2 | 97 | 860 | 143,932 |
| Householder who is Some Other Race alone | 19 | 3,244 | 39,917 | 4,916,427 |
| Householder who is Two or More Races | 176 | 6,366 | 52,350 | 2,199,727 |
| HOUSEHOLDS, HOUSEHOLD TYPE BY HOUSEHOLD SIZE | ||||
| Family households: Map | 3,999 | 318,152 | 2,554,073 | 77,538,296 |
| 2-person household Map | 1,484 | 135,375 | 1,116,122 | 31,882,616 |
| 3-person household Map | 1,071 | 74,571 | 575,906 | 17,765,829 |
| 4-person household Map | 737 | 66,272 | 490,745 | 15,214,075 |
| 5-person household Map | 427 | 27,923 | 230,373 | 7,411,997 |
| 6-person household Map | 167 | 9,350 | 87,344 | 3,026,278 |
| 7-or-more-person household Map | 113 | 4,661 | 53,583 | 2,237,501 |
| Nonfamily households: Map | 2,642 | 165,546 | 1,318,435 | 39,177,996 |
| 1-person household Map | 2,136 | 138,388 | 1,079,678 | 31,204,909 |
| 2-person household Map | 425 | 23,244 | 191,327 | 6,360,012 |
| 3-person household Map | 55 | 2,639 | 27,576 | 992,156 |
| 4-person household Map | 19 | 873 | 13,570 | 411,171 |
| 5-person household Map | 4 | 257 | 3,701 | 126,634 |
| 6-person household Map | 3 | 106 | 1,628 | 48,421 |
| 7-or-more-person household Map | 0 | 39 | 955 | 34,693 |
| HOUSING UNITS | ||||
| Total Housing Units Map | 7,611 | 527,255 | 4,532,233 | 131,704,730 |
| HOUSING UNITS, OCCUPANCY STATUS | ||||
| Occupied Map | 6,641 | 483,698 | 3,872,508 | 116,716,292 |
| Vacant Map | 970 | 43,557 | 659,725 | 14,988,438 |
| HOUSING UNITS, OCCUPIED, TENURE | ||||
| Owned with a mortgage or a loan Map | 3,140 | 264,844 | 1,920,245 | 52,979,430 |
| Owned free and clear Map | 1,131 | 86,144 | 873,097 | 23,006,644 |
| Renter occupied Map | 2,370 | 132,710 | 1,079,166 | 40,730,218 |
| HOUSING UNITS, VACANT, VACANCY STATUS | ||||
| For rent Map | 228 | 17,915 | 141,687 | 4,137,567 |
| Rented, not occupied Map | 7 | 733 | 6,684 | 206,825 |
| For sale only Map | 209 | 8,925 | 77,080 | 1,896,796 |
| Sold, not occupied Map | 52 | 1,949 | 17,978 | 421,032 |
| For seasonal, recreational, or occasional use Map | 13 | 4,112 | 263,071 | 4,649,298 |
| For migrant workers Map | 0 | 11 | 1,773 | 24,161 |
| Other vacant Map | 461 | 9,912 | 151,452 | 3,652,759 |
| HOUSING UNITS, OCCUPIED, AVERAGE HOUSEHOLD SIZE BY TENURE | ||||
| Total: Map | 2.47 | 2.46 | 2.49 | 2.58 |
| Owner occupied Map | 2.47 | 2.59 | 2.57 | 2.65 |
| Renter occupied Map | 2.48 | 2.12 | 2.29 | 2.44 |
| HOUSING UNITS, OCCUPIED, TENURE BY RACE OF HOUSEHOLDER | ||||
| Owner occupied: Map | 4,271 | 350,988 | 2,793,342 | 75,986,074 |
| Householder who is White alone Map | 3,978 | 302,375 | 2,452,233 | 63,446,275 |
| Householder who is Black or African American alone Map | 99 | 28,909 | 235,381 | 6,261,464 |
| Householder who is American Indian and Alaska Native alone Map | 38 | 749 | 13,611 | 509,588 |
| Householder who is Asian alone Map | 58 | 13,781 | 43,419 | 2,688,861 |
| Householder who is Native Hawaiian and Other Pacific Islander alone Map | 1 | 50 | 466 | 61,911 |
| Householder who is Some Other Race alone Map | 11 | 1,566 | 20,361 | 1,975,817 |
| Householder who is Two or More Races Map | 86 | 3,558 | 27,871 | 1,042,158 |
| Renter occupied: Map | 2,370 | 132,710 | 1,079,166 | 40,730,218 |
| Householder who is White alone Map | 1,767 | 81,271 | 706,229 | 26,308,077 |
| Householder who is Black or African American alone Map | 474 | 37,831 | 288,599 | 7,868,519 |
| Householder who is American Indian and Alaska Native alone Map | 13 | 519 | 9,065 | 430,119 |
| Householder who is Asian alone Map | 17 | 8,556 | 30,844 | 1,943,303 |
| Householder who is Native Hawaiian and Other Pacific Islander alone Map | 1 | 47 | 394 | 82,021 |
| Householder who is Some Other Race alone Map | 8 | 1,678 | 19,556 | 2,940,610 |
| Householder who is Two or More Races Map | 90 | 2,808 | 24,479 | 1,157,569 |
| HOUSING UNITS, OCCUPIED, TENURE BY HISPANIC OR LATINO ORIGIN OF HOUSEHOLDER | ||||
| Owner occupied: Map | 4,271 | 350,988 | 2,793,342 | 75,986,074 |
| Not Hispanic or Latino householder Map | 4,193 | 344,243 | 2,728,916 | 69,617,625 |
| Hispanic or Latino householder Map | 78 | 6,745 | 64,426 | 6,368,449 |
| Renter occupied: Map | 2,370 | 132,710 | 1,079,166 | 40,730,218 |
| Not Hispanic or Latino householder Map | 2,326 | 127,720 | 1,028,909 | 33,637,301 |
| Hispanic or Latino householder Map | 44 | 4,990 | 50,257 | 7,092,917 |
| HOUSING UNITS, OCCUPIED, TENURE BY HOUSEHOLD SIZE | ||||
| Owner occupied: Map | 4,271 | 350,988 | 2,793,342 | 75,986,074 |
| 1-person household Map | 1,260 | 80,222 | 643,556 | 16,453,569 |
| 2-person household Map | 1,351 | 123,274 | 1,031,004 | 27,618,605 |
| 3-person household Map | 757 | 58,983 | 446,449 | 12,517,563 |
| 4-person household Map | 489 | 54,794 | 392,843 | 10,998,793 |
| 5-person household Map | 253 | 22,886 | 177,918 | 5,057,765 |
| 6-person household Map | 94 | 7,351 | 64,470 | 1,965,796 |
| 7-or-more-person household Map | 67 | 3,478 | 37,102 | 1,373,983 |
| Renter occupied: Map | 2,370 | 132,710 | 1,079,166 | 40,730,218 |
| 1-person household Map | 876 | 58,166 | 436,122 | 14,751,340 |
| 2-person household Map | 558 | 35,345 | 276,445 | 10,624,023 |
| 3-person household Map | 369 | 18,227 | 157,033 | 6,240,422 |
| 4-person household Map | 267 | 12,351 | 111,472 | 4,626,453 |
| 5-person household Map | 178 | 5,294 | 56,156 | 2,480,866 |
| 6-person household Map | 76 | 2,105 | 24,502 | 1,108,903 |
| 7-or-more-person household Map | 46 | 1,222 | 17,436 | 898,211 |
Loading...